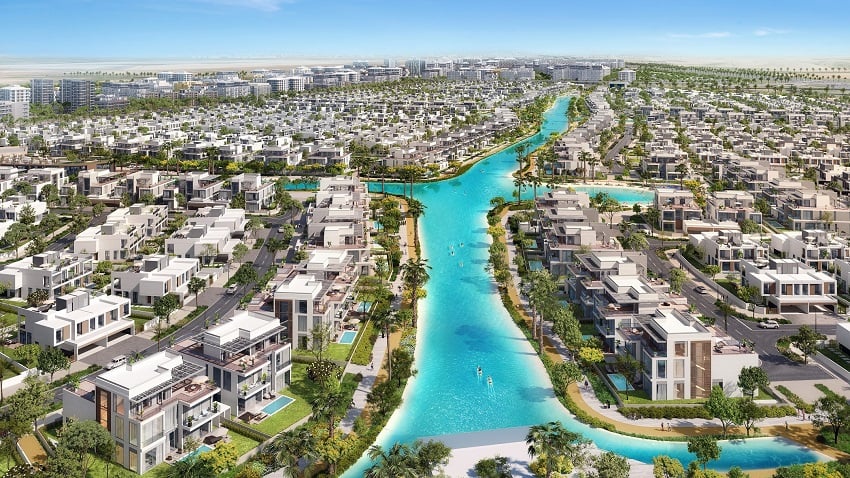
Dubai South Residential District
Madinat Al Mataar · 70 DLD-registered projects · Est. community
Comprehensive DLD data · Based on 70 DLD-registered projects
DLD community snapshot for Dubai South Residential District: 70 registered projects, 1,988 sales in the last 12 months, area yield ~1.7%, avg price 10.380 AED/m². Open top projects below for tower-level data — then run Offer Verdict on any live quote.
01Community snapshot
Dubai South Residential District is a Dubai community with 70 DLD-registered projects. Average yield 1.7% is below Dubai average — typical for established premium areas. Prices grew 0.1% in 12m. Best opportunity: AZIZI VENICE 9 (#218).
Avg yield 1.7% — below marketHigh liquidity: 1,988 sales/12m
02Key numbers
Projects
70
DLD registered
Avg yield
1.7%
below Dubai avg
Avg growth (12m)
+0.1%
growth
Avg total return (12m)
+0.4%
yield + growth
Avg price / m²
10.380
AED
Sales (12m)
1.988
high liquidity
03Yield distribution across projects
How yields spread across Dubai South Residential District's 70 projects
9%+
2
7–9%
12
5–7%
17
< 5%
1
No data
103
32 of 70 projects have yield data. 103 projects have no DLD rent/sale data yet.
04Price landscape
Price per m² range across Dubai South Residential District projects
Budget endPremium end
1.609avg 10.38027.531
Value picks
Parkside 3 8.246
Parkside 8.343
Greenview 3 10.689
Mid-range
Greenview 3 10.689
Parkside 8.343
Premium
Azizi Venice 6 21.365
Expo Valley Views 20.809
Azizi Venice 16 20.000
05Yield vs price — where's the value?
Projects with yield data plotted by price and return
0%
0%
0%
2k
14570
28k
Yield 8%+Yield 7–8%Yield 6–7%Yield <6%
The sweet spot: bottom-left quadrant — low price, high yield. Premium projects often trade yield for brand and appreciation potential.
06Investment insights
Below-average yields for Dubai
Community avg 1.7% is dragged down by premium projects. Projects with 7%+ yields significantly outperform — verify at building level.
Exceptional liquidity
1,988 sales in 12m across 70 projects — one of Dubai's most liquid communities. Easy entry and exit for investors.
Verify at project level
Community-level data aggregates many buildings. Use Offer Verdict for a price verdict, risk notes, and negotiation evidence on any specific quoted project.
07Top projects in Dubai South Residential District
Use this community context, then run Offer Verdict on any real quoted project to unlock risk notes, negotiation evidence, and a PDF-style report.
Run Offer Verdict ↗