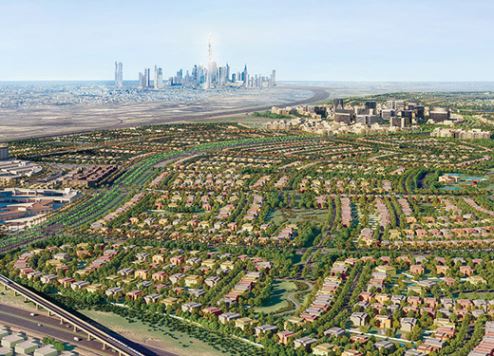
Dubai Hills Estate
Hadaeq Sheikh Mohammed Bin Rashid · 50 DLD-registered projects · Est. community
Comprehensive DLD data · Based on 50 DLD-registered projects
DLD community snapshot for Dubai Hills Estate: 50 registered projects, 2,552 sales in the last 12 months, area yield ~1.9%, avg price 21.004 AED/m². Open top projects below for tower-level data — then run Offer Verdict on any live quote.
01Community snapshot
Dubai Hills Estate is a Dubai community with 50 DLD-registered projects. Average yield 1.9% is below Dubai average — typical for established premium areas. Prices corrected -0.5% in 12m. Best opportunity: Collective (#96).
Avg yield 1.9% — below market-0.5% price correction 12mHigh liquidity: 2,552 sales/12m
02Key numbers
Projects
50
DLD registered
Avg yield
1.9%
below Dubai avg
Avg growth (12m)
-0.5%
correction
Avg total return (12m)
-0.3%
yield + growth
Avg price / m²
21.004
AED
Sales (12m)
2.552
high liquidity
03Yield distribution across projects
How yields spread across Dubai Hills Estate's 50 projects
9%+
6
7–9%
11
5–7%
6
< 5%
0
No data
27
23 of 50 projects have yield data. 27 projects have no DLD rent/sale data yet.
04Price landscape
Price per m² range across Dubai Hills Estate projects
Budget endPremium end
11.578avg 21.00430.342
Value picks
Dubai Hills - Hills View Community 15.789
Collective 17.666
Collective 2.0 18.487
Mid-range
Park Field 20.817
Park Horizon 21.297
Premium
ELLINGTON HOUSE II 22.655
Golf Grand 22.335
ELLINGTON HOUSE 21.914
05Yield vs price — where's the value?
Projects with yield data plotted by price and return
0%
0%
0%
12k
20960
30k
Yield 8%+Yield 7–8%Yield 6–7%Yield <6%
The sweet spot: bottom-left quadrant — low price, high yield. Premium projects often trade yield for brand and appreciation potential.
06Investment insights
Below-average yields for Dubai
Community avg 1.9% is dragged down by premium projects. Projects with 7%+ yields significantly outperform — verify at building level.
Price correction underway
-0.5% average growth in 12m. Premium segment may be hit hardest. Value picks could be closer to bottom — verify with recent DLD transactions.
Exceptional liquidity
2,552 sales in 12m across 50 projects — one of Dubai's most liquid communities. Easy entry and exit for investors.
Verify at project level
Community-level data aggregates many buildings. Use Offer Verdict for a price verdict, risk notes, and negotiation evidence on any specific quoted project.
07Top projects in Dubai Hills Estate
| Project | Rank | Yield | Growth | Total | AED/m² | |
|---|---|---|---|---|---|---|
| CollectiveDUBAI HILLS ESTATE L.L.C | #96 | 8.8% | +1.3% | +10.1% | 17.666 | Project → |
| ELLINGTON HOUSE IIEH 2 DEVELOPMENT L.L.C | #204 | 9.6% | — | — | 22.655 | Project → |
| ELLINGTON HOUSEEPD DEVELOPMENT L.L.C | #261 | 9.5% | — | — | 21.914 | Project → |
| Park FieldDUBAI HILLS ESTATE L.L.C | #362 | 9.1% | — | — | 20.817 | Project → |
| Golf GrandDUBAI HILLS ESTATE L.L.C | #387 | 8.5% | — | — | 22.335 | Project → |
| SocioDUBAI HILLS ESTATE L.L.C | #438 | 9.3% | — | — | 20.369 | Project → |
| Dubai Hills - Hills View CommunityDUBAI HILLS ESTATE L.L.C | #471 | 22.6% | — | — | 15.789 | Project → |
| Collective 2.0DUBAI HILLS ESTATE L.L.C | #783 | 8.6% | — | — | 18.487 | Project → |
| PARK RIDGEDUBAI HILLS ESTATE L.L.C | #790 | 7.8% | — | — | 18.565 | Project → |
| Lime GardensDUBAI HILLS ESTATE L.L.C | #791 | 8.2% | — | — | 21.755 | Project → |
| Golf villeDUBAI HILLS ESTATE L.L.C | #852 | 8.1% | — | — | 19.782 | Project → |
| Golf Suites - Dubai HillsDUBAI HILLS ESTATE L.L.C | #891 | 8.5% | — | — | 18.812 | Project → |
| THE GROVE BY IMANIMAN DEVELOPERS L.L.C | #893 | 8.4% | — | — | 21.884 | Project → |
| Park HorizonDUBAI HILLS ESTATE L.L.C | #923 | 8.1% | — | — | 21.297 | Project → |
| Hills ParkDUBAI HILLS ESTATE L.L.C | #1046 | 7.8% | — | — | 19.468 | Project → |
Use this community context, then run Offer Verdict on any real quoted project to unlock risk notes, negotiation evidence, and a PDF-style report.
Run Offer Verdict ↗