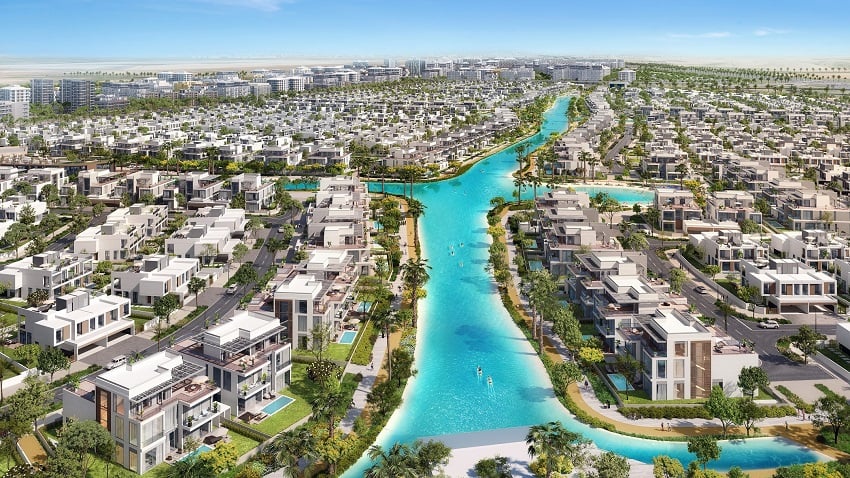
Dubai South Residential District in Dubai
Madinat Al Mataar · 70 DLD-registered projects · Est. community
Comprehensive DLD data · Based on 70 DLD-registered projects
Dubai South Residential District in Madinat Al Mataar has 70 DLD-registered projects and 1,521 sales in the last 12 months, area yield ~1.1%, avg 10,433 AED/m². Compare any broker ask to those registered sold prices — not portal listings.Source: Dubai Land Department registered transactions.
Paste a Dubai South Residential District quote — first report free →
01Community snapshot
Dubai South Residential District is a Dubai community with 70 DLD-registered projects. Average yield 1.1% is below Dubai average — typical for established premium areas. Prices corrected -0.1% in 12m. Best opportunity: MAG 5 BOULEVARD (#93).
Avg yield 1.1% — below market-0.1% price correction 12mHigh liquidity: 1,521 sales/12m
02Key numbers
Projects
70
DLD registered
Avg yield
1.1%
below Dubai avg
Avg growth (12m)
-0.1%
correction
Avg total return (12m)
+0.5%
yield + growth
Avg price / m²
10,433
AED
Sales (12m)
1,521
high liquidity
03Yield distribution across projects
How yields spread across Dubai South Residential District's 70 projects
9%+
2
7–9%
5
5–7%
11
< 5%
1
No data
51
19 of 70 projects have yield data. 51 projects have no DLD rent/sale data yet.
04Price landscape
Price per m² range across Dubai South Residential District projects
Budget endPremium end
1,609avg 10,43318,209
Value picks
The Pulse Boulevard Apartments - C3 7,700
The Pulse- Beachfront 8,029
The Pulse Residence Park 8,273
Mid-range
The Pulse Villas 2 11,005
CELESTIA 11,182
Premium
Astra Residences 18,209
MAJESTIQUE RESIDENCE 2 14,803
Manam Prime 12,362
05Yield vs price — where's the value?
Projects with yield data plotted by price and return
0%
0%
0%
2k
9909
18k
Yield 8%+Yield 7–8%Yield 6–7%Yield <6%
The sweet spot: bottom-left quadrant — low price, high yield. Premium projects often trade yield for brand and appreciation potential.
06Investment insights
Below-average yields for Dubai
Community avg 1.1% is dragged down by premium projects. Projects with 7%+ yields significantly outperform — verify at building level.
Price correction underway
-0.1% average growth in 12m. Premium segment may be hit hardest. Value picks could be closer to bottom — verify with recent DLD transactions.
Exceptional liquidity
1,521 sales in 12m across 70 projects — one of Dubai's most liquid communities. Easy entry and exit for investors.
Verify at project level
Community-level data aggregates many buildings. Use Offer Verdict for a price verdict, risk notes, and negotiation evidence on any specific quoted project.
06Double win in Dubai South Residential District
Projects with yield ≥6% and appreciation ≥10% — rare combo
07Top projects in Dubai South Residential District
Use this community context, then run Offer Verdict on any real quoted project for risk notes and negotiation evidence. Print the report to PDF from the browser.
Run Offer Verdict ↗AlsoNearby DLD community reports
- Dubai Studio City· 1,474 sales 12m
- Silicon Oasis· 1,569 sales 12m
- DownTown Dubai· 1,409 sales 12m
- DAMAC HILLS· 1,376 sales 12m
- Dubai Hills Estate· 1,677 sales 12m
- Al Furjan· 1,678 sales 12m
AlsoDevelopers in this area
FAQDirect answers
- What is the rental yield in Dubai South Residential District, Dubai?
- DLD-backed average gross yield across Dubai South Residential District is about 1.1%. Building-level yields differ — check the project page or run Offer Verdict on a quoted unit.
- How many DLD projects are in Dubai South Residential District?
- Dubai South Residential District has 70 DLD-registered projects and 1,521 sales in the last 12 months.
- How do I check a broker price in Dubai South Residential District?
- Paste the asking price into the Dubai Offer Verdict checker (/check). The first verdict is free; it compares the ask to DLD registered sold prices, not Property Finder listings.
- What is the average price per m² in Dubai South Residential District?
- Recent DLD averages around 10,433 AED/m² in Dubai South Residential District. Use comps on the same building — community averages mix towers.