Why New Dubai Projects Look Busy in DLD Data — and What It Actually Means
Summary
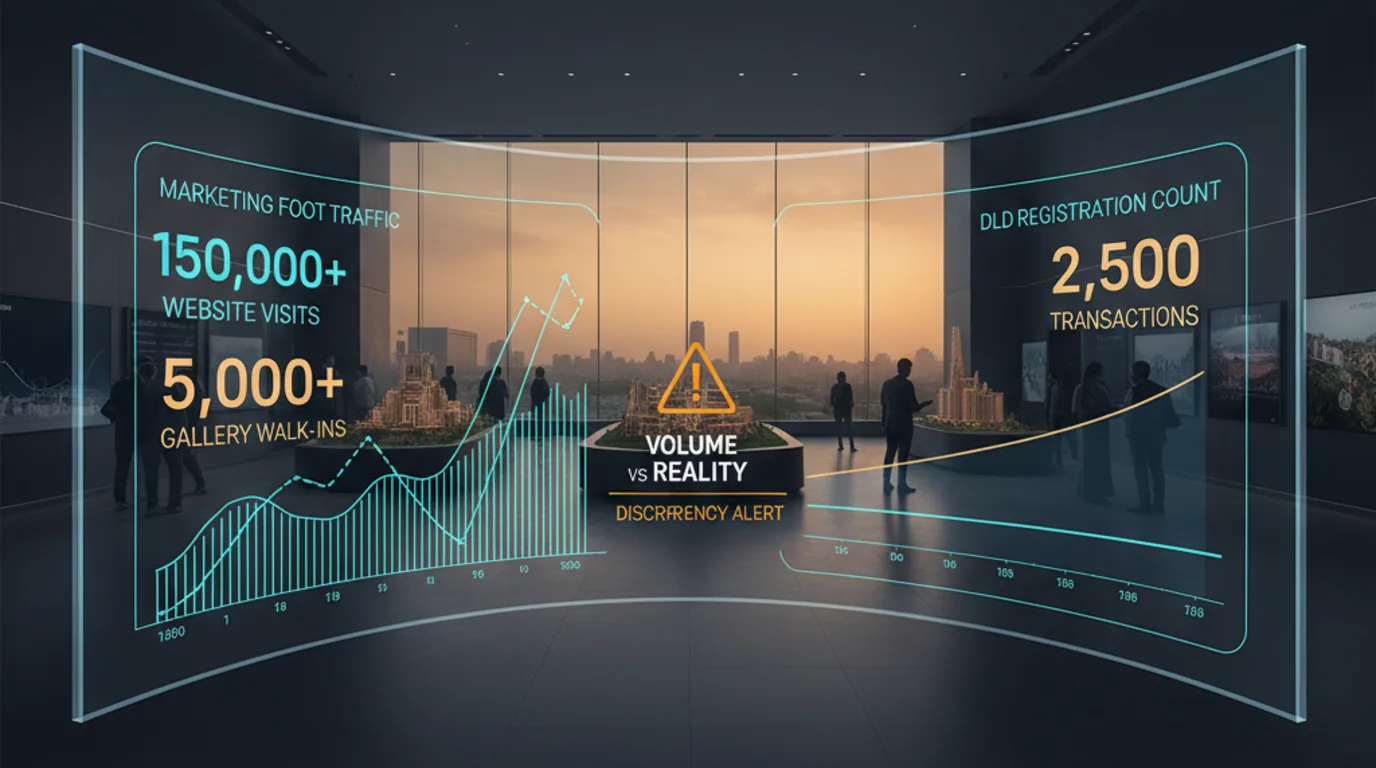
Volume ≠ turnover
Oqood bulk registrations can inflate busy-looking launches without resale depth.
12-month resale count
The exit test — under ~20 annual sales is thin for most investors.
Price dispersion
Wide AED/sqft spread in one tower means medians lie — check building tape.
Content reviewed: May 23, 2026.
New project DLD transaction volume is one of the most consistently misread signals in Dubai property analysis. High registration counts at launch tell you that units were registered — they do not tell you who registered them, why, or whether the demand represented is durable end-user demand or short-cycle investor activity that will re-enter the market as competing supply at handover. Understanding the difference is the foundation of evaluating a new project's actual demand quality.
What a DLD Transaction at Launch Actually Records
When a developer sells a unit off-plan, the sale is registered with DLD as a transaction at the agreed price. This registration is what appears in DLD data as a transaction. On that basis, a project with 400 DLD transactions in its first month has 400 registered sales — which is factually accurate.
What the transaction count does not distinguish:
Bulk investor purchases. A single investor or investment group buying 40 units registers as 40 DLD transactions. The demand signal — 40 buyers want this project — is inaccurate. One buyer wants this project, at scale, likely for resale. Those 40 units will re-enter the market as competing secondary supply at handover.
Agent and employee allocations. Some developers allocate units to key agents or staff at launch at discounted prices. These register as DLD transactions at the stated price. The transaction is real; the price may not reflect open-market demand at that level.
Payment plan registrations. In some structures, a unit is registered at DLD at launch even when only the booking fee (typically 5–10% of purchase price) has been paid. The full purchase price appears in DLD data, but the buyer's commitment is limited to the booking fee until the next payment milestone.
Phased re-registrations. Some off-plan transactions are re-registered as construction milestones complete or as payment structures are restructured. A unit can generate multiple DLD entries through its lifecycle, not all of which represent a new buyer at a new price.
None of these data points are visible in raw DLD transaction counts. The count shows registrations — not independent buyers, not end-users, not evidence that 80% of units have durable committed demand behind them.
The Investor Flip Risk: Demand That Becomes Supply
The specific risk profile of new Dubai projects with high early investor concentration is that the demand is temporary and self-cancelling. A project that sells 60% of its units to investors who intend to flip at handover has not captured 60% of demand from the end-user market — it has created 60% of future competing supply that will re-enter the market at the same time as developer handover units.
At handover, the project simultaneously receives: completion units from buyers who financed through construction and now want to sell, investor units from buyers who held through construction and now want to exit, and developer retained stock being marketed through agents. All of this competing supply hits the secondary market in the same 12–18 month window.
In a project where 70% of buyers were investors rather than end-users, this handover supply surge can be larger than the project's annual absorption capacity in a normal secondary market. The result is price compression in the secondary market at exactly the moment most buyers expected to realise their appreciation.
DLD data does not label buyers as investors or end-users. But proxy signals exist: buyer nationality concentration (a single nationality at very high concentration suggests bulk investor purchasing), transaction clustering in a short time window at launch (suggesting coordinated block purchases rather than organic individual buying), and — most importantly — subsequent secondary market SPA resales appearing in DLD data within 12 months of initial registration (indicating buyers who are already trying to exit before handover).
Developer Sales vs Secondary Market: The Critical Distinction
The most important filter to apply to new project DLD data is separating developer first sales from secondary market transactions.
Developer first sales are registrations from the developer to the first buyer. High developer first sale volume tells you the developer sold units. It does not tell you about end-user demand, price sustainability, or secondary market depth.
Secondary market transactions are registrations from one buyer to another buyer — resales. These are genuine market transactions where an independent seller and an independent buyer agreed on price without developer involvement. Secondary market transaction volume in a new project is the most reliable demand quality signal available in DLD data.
A project with 400 developer first sale registrations and 5 secondary market transactions in 12 months has almost no demonstrated secondary market demand. A project with 200 developer first sale registrations and 80 secondary market transactions in the same period has a genuine secondary market operating — buyers are finding each other independently at prices that reflect open-market demand.
What Genuine Demand Looks Like in DLD Data
Strong demand quality signals in DLD data for a new project:
Secondary market transaction volume growing as the project approaches handover — buyers who want completed units in this project are seeking them out in the resale market before official handover, indicating demand that extends beyond the initial launch excitement.
Price per sqft in secondary market transactions at or above developer launch price — the resale market is clearing at prices consistent with initial pricing, meaning launch price was set at or below market rather than ahead of it.
Ejari contract density building in the first 12 months post-handover — new completions generating registered tenancy contracts quickly indicate genuine occupier demand rather than vacant investor-held stock waiting for the next buyer.
Diverse buyer profile in DLD data — nationality and buyer type distribution across many individual transactions rather than concentration in a small number of bulk purchasers.
These signals are not instantly available at launch. They develop over 12–36 months as a project moves through construction and into handover. The most reliable time to evaluate a new project's actual demand quality in DLD data is 12–18 months after handover, when the secondary market and Ejari data tell the full story. Buying at launch requires accepting that you are working with incomplete demand quality information.
How to Evaluate a New Project in DLD Data
For any new project you are considering, the DLD data questions to answer:
What is the ratio of secondary market transactions to developer first sales in the past 12 months? A ratio above 30% (secondary/total) indicates a functioning resale market. Below 10% indicates almost all activity is still developer-driven.
Is the secondary market price per sqft above, at, or below developer launch price? Above or at indicates the launch price was not ahead of market. Significantly below indicates the secondary market is not validating launch pricing.
What is the buyer profile concentration? High concentration of a single buyer type suggests bulk purchasing rather than diversified organic demand.
Are there Ejari registrations in the building post-handover, and at what density? Ejari contract density is the end-user demand reality check — it shows whether actual occupiers are moving in at the rents that support the yield calculation.
Use Dubai REST / Dubai Pulse / Ejari exports for any specific project — transaction volume, price trend, secondary market depth, and Ejari density are the fields to reconcile with what the developer is claiming. When patterns match the risk cases above, treat them as disqualifiers until the register proves otherwise. For a concrete quoted price, run /#broker-offer-checker on this website; buy the paid pack when you need the full negotiation evidence.
Before you wire
We would not wire a deposit on portal copy alone. Pull 12-month DLD registered closes for your project and size band in Dubai REST or Dubai Pulse, then run /#broker-offer-checker on this website when you have the quoted package. Buy the paid pack (5 analyses, USD 50 on Gumroad) when you need exact comps, broker questions, and counter-offer wording for Form F or SPA review.
FAQ
Does high DLD transaction volume at launch mean a Dubai project is in strong demand? Not necessarily. High launch volume can reflect bulk investor purchases (one buyer registering many units), developer-arranged early sales to agents or key parties, or payment plan structures where registration occurs at booking rather than full commitment. The meaningful demand signal is secondary market transaction volume — resales from one independent buyer to another — which takes 12–24 months to develop in a new project and is a far more reliable indicator than launch registration count.
What percentage of Dubai off-plan buyers are investors vs end-users? It varies significantly by project, price point, and location. Mid-market projects in JVC and JLT with payment plans structured for local professional buyers tend to have higher end-user concentration. Ultra-prime and branded residences tend to have higher investor concentration. Projects with very short construction timelines (12–18 months) attract more investors because the flip timeline is shorter. DLD data does not label buyer intent, but secondary market SPA resale activity within 12 months of initial registration is a strong proxy for investor flipping intent.
What should I look for in DLD data when evaluating a new Dubai project? Secondary market transaction volume relative to developer first sales (a functioning resale market is the key demand quality signal), price trend in secondary market transactions versus launch price (is the market validating launch pricing?), Ejari contract density post-handover (are end-users actually occupying at rents that support the yield calculation?), and buyer profile concentration (are bulk investors driving the volume?). Pull these signals from Dubai REST, Dubai Pulse, and Ejari for the project you are underwriting — then benchmark any package you are shown with /#broker-offer-checker on this website.
What is the investor flip risk in Dubai off-plan property? When a high proportion of initial buyers are investors intending to sell at or around handover, the secondary market at handover receives a supply surge from multiple motivated sellers at the same time. This competing supply — previous buyers trying to exit, plus developer retained stock — can compress prices in the secondary market at exactly the point when most buyers expected to realise appreciation. The risk is highest in projects with high investor concentration at launch, long construction timelines that allow investor sentiment to shift, and communities already facing high pipeline supply from other projects.